Combine several strategies and check how they correlate
Add saved configurations to your portfolio, read the combined balance and check the correlation between them.
To combine strategies, save a configuration for each one, tick the ones you want under Portfolio on the strategy's Edit tab and read the combined Balance chart on the Strategies page. The Strategy correlation chart below it shows whether your configurations tend to win and lose at the same time.
Who this is for and what you get
This guide is for you if you have more than one strategy, or more than one saved configuration, and want to see how they behave together. You end up with a combined balance curve with its return, drawdown and trade count, and a correlation chart that shows which configurations overlap.
Before you start
- At least two saved configurations with trades, for the correlation chart. One is enough for the balance chart. Save them from the Analysis tab. See Find the best stop loss and take profit.
- Your plan limits the number of strategies and saved configurations. See Plans and billing.
1. Save a configuration for each strategy
For every strategy you want to include:
- Open the strategy and choose the Analysis tab.
- Click the line of the stop loss and take profit pair you want.
- Choose Save, enter a Configuration name and choose Save.
2. Add them to the portfolio
- Open each strategy and choose the Edit tab.
- Under Portfolio, tick the configurations that should count towards the combined balance.
The dashboard is read-only. Everything that changes what counts is done here.
3. Read the combined balance
- Choose Strategies in the sidebar.
- Keep the Backtest option selected. The Live option is a placeholder and says Live performance is not available yet.
- Choose a period: Week, Month or Year.
The Balance chart combines the configurations in your portfolio. It starts from a shared $1,000, includes fees and uses a log scale. Next to it you see the return, profit in R, fees paid, maximum drawdown, win rate and trade count for the period.
Compare the maximum drawdown of the combined balance with the drawdowns of the single configurations. If the combination has a smaller drawdown for a similar return, the strategies are helping each other.
If some configurations could not be evaluated, the chart says so and shows the ones that could. Retry appears if data could not be loaded.
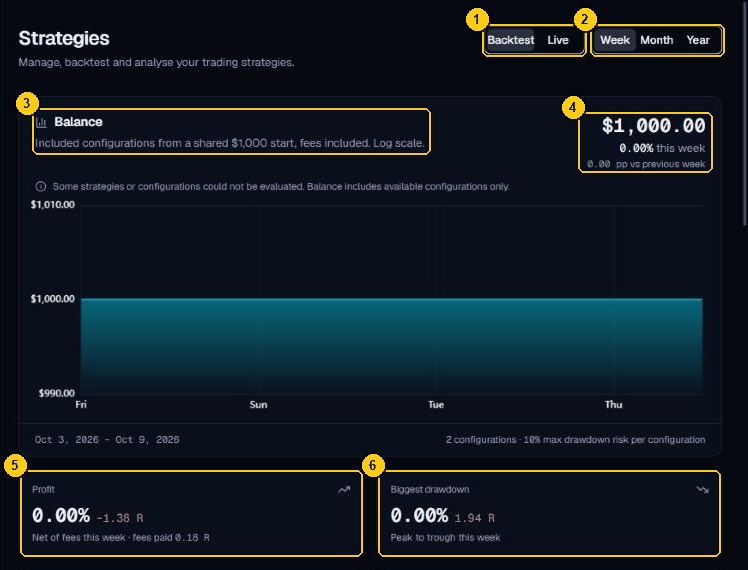
- Backtest and Live choose which results the page shows.
- Week, Month and Year set the period.
- Balance: every included configuration from a shared $1,000 start, fees included.
- The balance now, and its change over the period.
- Profit for the period, in percent and in R.
- Biggest drawdown for the period.
4. Read each strategy card
Under Your strategies, each card lists the saved configurations with the stop loss and take profit pair, Annual return, Adj. expectancy, Rec. risk, Trades / year and whether it is In portfolio. The card also says at which maximum drawdown the figures are calculated. A dashed border marks a configuration that could not be evaluated, with the reason.
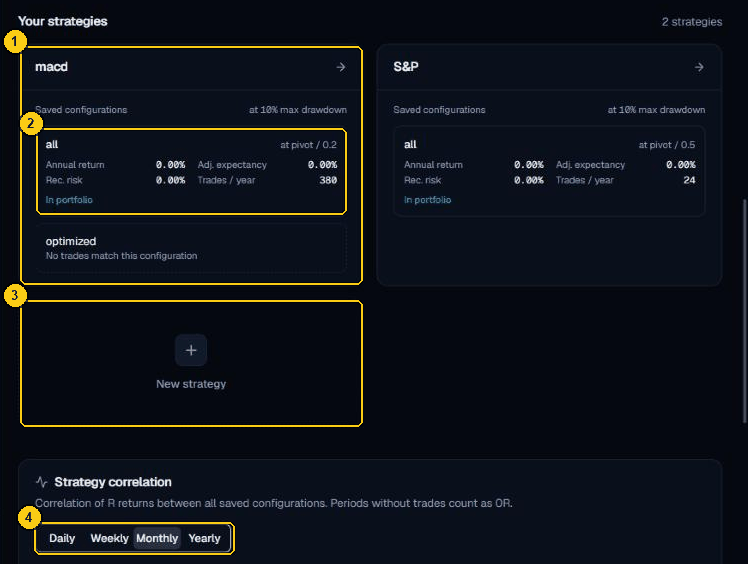
- A strategy card. Open it to work on the strategy.
- A saved configuration with its stop loss and take profit pair and its figures. In portfolio marks a configuration that counts towards the balance.
- New strategy creates another strategy.
- The period of the correlation chart below.
5. Check the correlation
At the bottom, Strategy correlation shows the correlation of R returns between all your saved configurations. Periods without trades count as 0R. Use the tabs above the chart to choose Daily, Weekly, Monthly or Yearly. The default is Monthly.
- A value near 1 means two configurations tend to make money and lose money in the same periods. Combining them adds little diversification.
- A value near 0 means they move independently.
- A negative value means one tends to gain when the other loses.
Check more than one period. Correlation computed from few periods is not reliable, and it can change when markets change. Two configurations on the same market and timeframe, built on similar logic, are likely to correlate. Because periods without trades count as 0R, rarely trading configurations can look less correlated than they are.
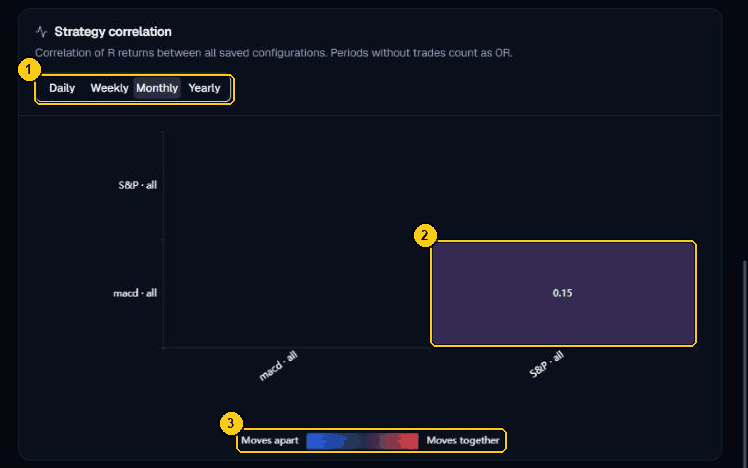
- Daily, Weekly, Monthly and Yearly: the periods whose returns are compared.
- The correlation of two configurations, here 0.15.
- The scale, from Moves apart to Moves together.
6. Adjust and repeat
Untick a configuration under Portfolio, or save a different pair, and look at the Balance chart and the correlation again. Change one thing at a time.
Common problems
- No saved configurations yet. Open the strategy and save one from its Analysis tab.: save one first.
- The chart asks you to include a configuration: nothing is ticked under Portfolio, or the ticked ones have no matching trades.
- No correlation chart: it appears only when at least two saved configurations have trades.
- The Live view is empty: live performance is not built yet. See FAQ and troubleshooting.
Next
- Go live with a backtested strategy on cTrader. Read the risks first.
- Reference: The strategy dashboard, The strategy workspace and its tabs.
- The Risk management and position sizing course in The Learn section explains drawdown and sizing.