Find out when a strategy works and when it does not
Use filters, the expectancy by filter chart and the calendar to see which conditions help or hurt your strategy.
To find out when a strategy works and when it does not, use the Filters in the Analysis tab to restrict the trades by indicator values, price points, time and market, and read Expectancy by filter value and the Calendar next to them. If a condition clearly separates good trades from bad ones, you can save it in a configuration.
Who this is for and what you get
This guide is for you if a strategy has a positive result overall but you suspect it works better in some conditions, such as one market or a certain value of an indicator. You end up with a view of where the strategy earns and where it loses, and optionally a saved configuration that includes only the conditions you chose.
Before you start
- Saved trades for the strategy. See Test a trading idea by hand or Build a graph and backtest it automatically.
- A pair focused in the Analysis tab, so the metrics describe a single stop loss and take profit pair.
- For filters on your own values, indicators or price points defined on the strategy. Add them on the Edit tab under Name and components, and fill them in when you place trades or record them from the graph. See The strategy workspace and its tabs.
1. Get the baseline
- Open the Analysis tab and click the line of the pair you care about.
- Note Win rate, Expectancy, Net profit, Total closed trades and the maximum drawdown.
Everything you do next is compared with these numbers.
2. See how expectancy changes across a filter
- Find Expectancy by filter value.
- Open the Filter menu and pick a filter.
- Read the bars. Each shows the expectancy for one value or range of that filter. The tooltip also shows how many trades it contains.
Ignore bars with few trades. They are the ones most likely to be luck.
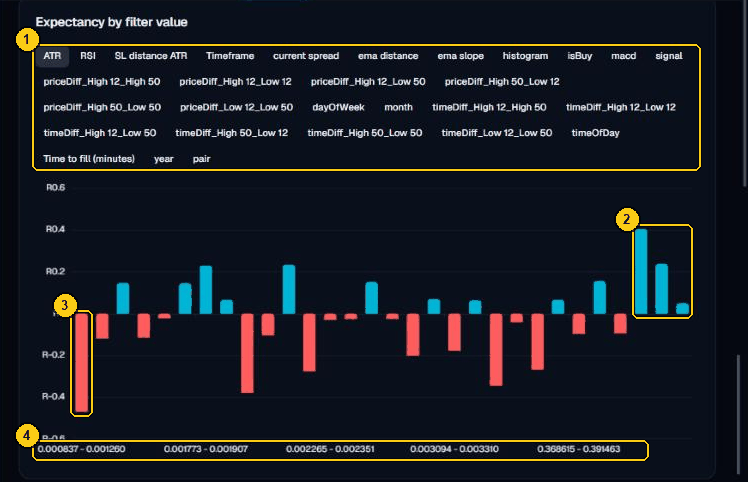
- The filters recorded with the trades of this strategy. Choose one to draw it. This example has indicator values such as ATR and RSI, and time values such as dayOfWeek, month and timeOfDay.
- Bars above zero: value ranges in which the average trade made money.
- Bars below zero: value ranges in which the average trade lost money.
- The value range each bar stands for.
3. Look at time
The Calendar shows results by Week, Month or Year, with the number of trades (Count). Look for:
- one period that carries all the profit,
- long stretches where the strategy loses,
- a trend from good to bad over time, which can mean the market changed.
If the analysis offers a time-related filter, it appears in Filters and in the Filter menu above. One example is Time to fill (minutes). The filters you see depend on your strategy and the data the analysis service returns.
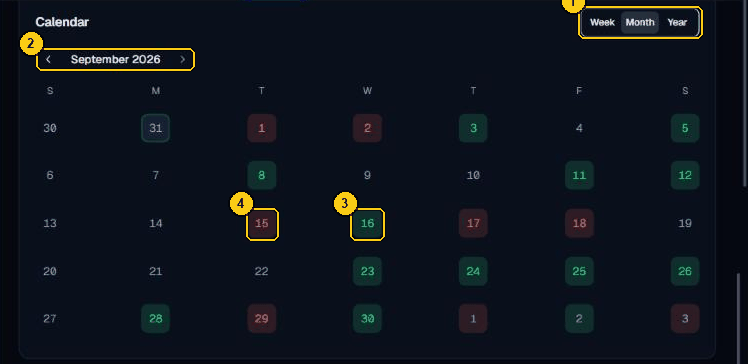
- Week, Month and Year change the period.
- Step to the previous or next period.
- A day that ended with a profit.
- A day that ended with a loss.
4. Apply filters and compare
- Choose Filters.
- Adjust what you want to test. Number filters use sliders. Selection filters use chips. Indicator filters can use ranges.
- Choose Apply filters.
- Read Key metrics again and compare with the baseline. Look at Total closed trades: it shows how many trades the filter removed.
- Choose Reset to go back to all trades.
Change one filter at a time, so you know which one made the difference.
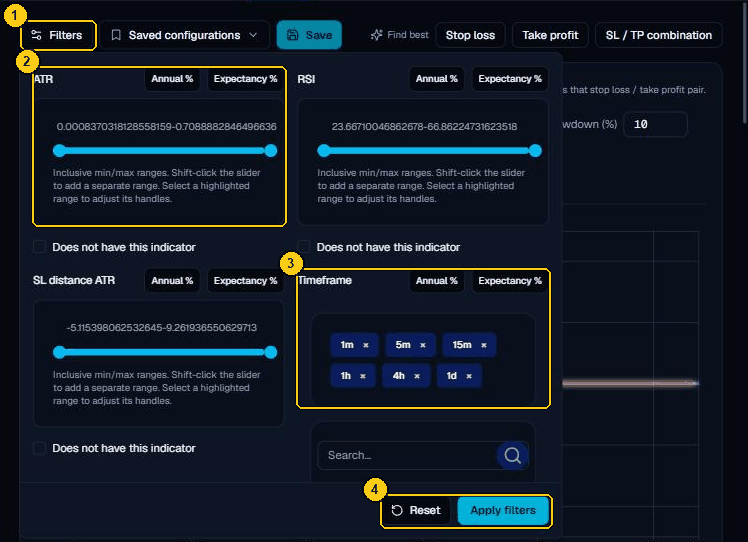
- Filters opens and closes the panel.
- A range filter. Drag the handles to keep only trades inside the range.
- A selection filter. Tick the values to keep.
- Reset clears the filters. Apply filters recalculates the page.
5. Ask the app for a suggestion
Each filter in the Filters window has two buttons. Annual % searches for the setting with the best adjusted annualised return. Expectancy % searches for the best adjusted expectancy per trade. A progress line shows how many combinations were tested.
Treat the suggestion as a hypothesis. The search is free to find a pattern that exists only in your sample. Before you keep it:
- check that enough trades are left,
- ask whether you can explain why the condition should matter,
- compare Win rate and Net profit before and after on the same pair,
- test on trades from a period you did not use, for example by generating more trades for a later date range.
Keep a test period for the end
Each filter you try is a tried variant, and the bars of Expectancy by filter value make it easy to keep only the winners. Turn on Hold back a test period before you start: the filters, bars and calendar then only use the older research trades. When you have settled on a condition, read In the test period in Key metrics. It shows the same filters on the newest trades, which you never explored. If the result there is Does not hold up, the condition was most likely a pattern of your sample only. The line after N variants tried in Key metrics shows how far the edge probability falls once all the filter settings you tried are counted.
6. Inspect the trades
Open Trades to see the trades behind the numbers. Sort by a column, switch Sort order between Newest and Oldest or use Search tags. Open trade chart shows how a single trade played out. Looking at the worst trades one by one often tells you more than a chart does.
7. Save it
Choose Save, enter a Configuration name and choose Save. The configuration stores the pair, the fee setting and your filters. Applying it later restores all three. If you want the strategy itself to avoid a condition, such as certain hours, you can also build it into the graph. The Time node limits trading to a schedule. See Node reference.
Common problems
- No metrics yet: click a line to focus a pair.
- A filter you expected is missing: the list depends on the strategy and the data. Indicators and price points must exist on the strategy and have values on the trades.
- Results swing wildly after filtering: too few trades are left. Loosen the filter or generate more trades.
Next
- Filter out weak setups with an AI model, which learns patterns for you.
- Find the best stop loss and take profit
- Reference: Analysis.