Test a trading idea by hand before automating it
Replay historical candles, place trades by your own rules and read the first analysis before you build anything.
To test a trading idea before you automate it, replay historical candles in the Backtest tab, place the trades you would have taken and read the result in the Analysis tab. You see only the candles up to the replay point, so each decision is made without hindsight.
Who this is for and what you get
This guide is for you if you have an idea, such as "I buy pullbacks to a moving average", and want to know whether it is worth pursuing. You end up with a set of saved trades for the idea, an equity curve and a first set of metrics. You also get a feeling for how the idea behaves before you spend time building a graph.
Before you start
- An account. The Free plan is enough. See Create an account and log in.
- A strategy with at least one stop loss and one take profit. They are named levels that you add on the Edit tab. The walkthrough Your first strategy in 10 minutes shows how.
- A written rule for the idea, even a rough one. Decide what counts as a setup, where the stop goes and where the target goes. Without a rule you will drift towards trades that look good in hindsight.
1. Create the strategy and its exits
- On Strategies, choose New strategy, enter a Name and choose Create strategy.
- Open the strategy and choose the Edit tab.
- Under Name and components, choose Edit name and components.
- Next to Stop Losses, choose Add and name one, for example
SL1. Do the same under Take Profits withTP1. - Choose Done.
Each extra stop loss or take profit you add becomes an extra line on the chart when you place a trade, so you can compare several exits on the same entries.
2. Replay the market
- Open the Backtest tab and wait for the chart. While it connects, it says Connecting to backtest server….
- Pick a market in the selector at the top left.
- Choose the date button and set a start date in Select replay start date.
- Choose a timeframe above the chart: 1m, 5m, 15m, 1H, 4H or 1D.
- Step forward with Next candle (Right arrow), or use Play (Space) and Pause. The speed buttons are 1x, 2x and 5x.
Use one market and one timeframe at first. Keep the rule you wrote in front of you.
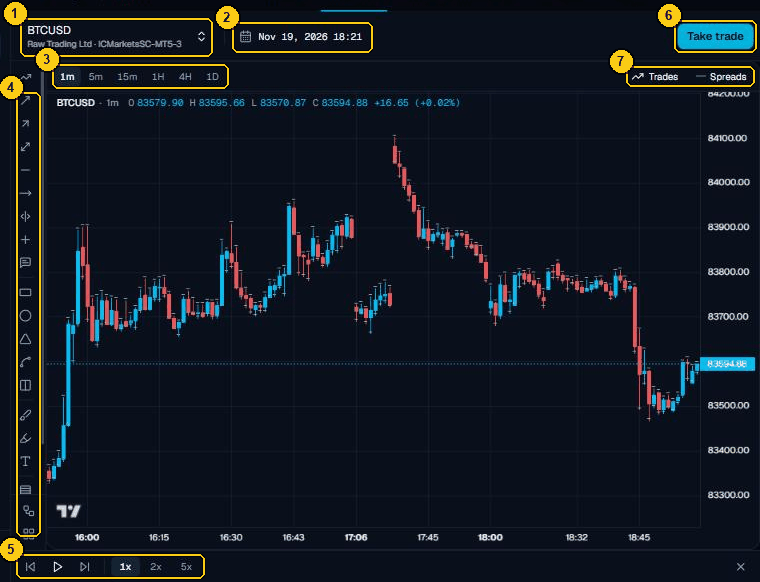
- The market you are replaying.
- The date and time the replay stands at. Choose it to set the replay start.
- The timeframes, from 1m to 1D.
- The drawing tools.
- The replay controls: step back, Play, step forward and the speeds 1x, 2x and 5x.
- Take trade opens the form for the next trade.
- Show or hide Trades and Spreads on the chart.
3. Place each trade by the rule
- When the setup from your rule appears, choose Take trade.
- Drag the white Entry line, the SL line and the lines for your stop losses and take profits to the prices your rule gives.
- Choose Apply trade.
- If your strategy has indicators, fill in Indicator values and choose Confirm.
The app confirms with Trade submitted. Place a trade only when the rule says so, including the ones that look unpromising. If you only place the trades you like, the results will be better than the idea deserves. More detail is in Manual backtesting.
4. Read the first result
- Open the Analysis tab.
- The Equity curve shows one line for each stop loss and take profit pair. Click a line to focus it.
- Read Key metrics for the focused pair: Win rate, Expectancy, Net profit and the drawdown and streak figures.
- Open Trades to look at individual trades. Open trade chart shows how a trade played out.
Expectancy is the average result per trade in R, where R is one unit of risk. A positive number means the pair would have made money on average over these trades. The Adjusted figures are more cautious estimates. Treat all of them as estimates.
How many trades you have matters more than any single number. A handful of trades says very little, and the page's own metrics are unreliable on small samples. If the result looks good, place more trades on other periods and markets before you believe it.
5. Keep what you learned
Choose Save at the top of Analysis and give the result a Configuration name. Saved configurations feed the combined balance, AI training and live automations later.
Common problems
- Not enough candle data or Chart not ready yet when you choose Take trade: wait for the chart to load, or move the start date to a time with more history before it.
- The page stays on "Connecting to backtest server…": reload and check your connection. See FAQ and troubleshooting.
- No metrics yet: click a line in the equity curve to focus a pair.
- You hit a plan limit on strategies: see Plans and billing.
Next
- Let the app find the setups for you: Build a graph from your rules and backtest it automatically.
- Choose better exits: Find the best stop loss and take profit.
- Reference: Manual backtesting, Analysis, The strategy workspace and its tabs.