Find the stop loss and take profit that suit a strategy
Compare stop loss and take profit pairs in the analysis, use Find best, check the winner and save it as a configuration.
To find the stop loss and take profit that suit a strategy, open its Analysis tab, compare the equity curve of each stop loss and take profit pair, and use Find best to search for the pair with the highest adjusted expectancy per trade. Then check that enough trades support the winner and save it as a configuration.
Who this is for and what you get
This guide is for you if you already have saved trades for a strategy and want to choose its exits with evidence instead of by feel. You end up with a saved configuration: a stop loss and take profit pair, your fee setting and any filters, with metrics you can read and reuse.
Before you start
- Saved trades for the strategy, from manual backtesting or an auto backtest.
- More than one stop loss or take profit on the strategy. The analysis compares the named ones that exist, so add the candidates on the Edit tab under Name and components. With only one of each, there is nothing to compare.
- Enough trades. The page's metrics are unreliable on small samples.
1. Open the analysis and look at every pair
- Open the strategy and choose the Analysis tab.
- The Equity curve draws one line for each stop loss and take profit pair. Use the Stop loss and Take profit chips to choose which pairs are drawn.
- Turn on Include fees so the results include execution fees. Fees change which exit wins.
- Set Starting balance and Max expected drawdown (%). The second is the drawdown that the risk sizing aims for.
- Turn on Show RR curve if you want to compare in R rather than in account balance.
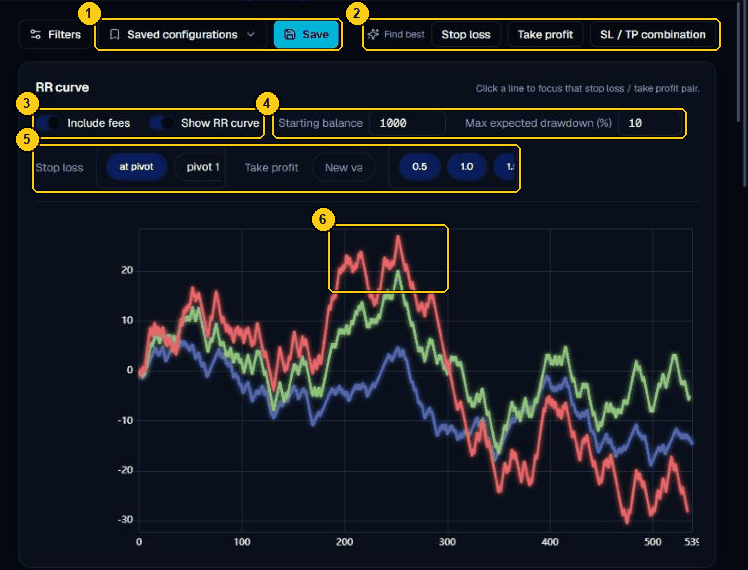
- Saved configurations and Save: load a saved setup, or store the current one.
- Find best: search by Stop loss, Take profit or SL / TP combination.
- Include fees and Show RR curve: count execution fees, and switch between account balance and R.
- Starting balance and Max expected drawdown (%): the inputs for risk sizing.
- The Stop loss and Take profit chips choose which pairs are drawn.
- One line per pair. Click a line to focus that pair.
2. Focus a pair and read it
Click a line to focus a pair. Key metrics then describes it.
- Win rate and Total closed trades.
- Expectancy, observed and adjusted: the average result per trade in R. The adjusted figure is the more cautious one.
- Recommended risk and Adjusted full Kelly under Risk sizing.
- Net profit, Longest drawdown and the win and loss streaks.
- Edge probability, a model-based figure and not a promise.
Compare the pairs on expectancy and drawdown together. A pair with a slightly higher expectancy but a much deeper drawdown may not suit you.
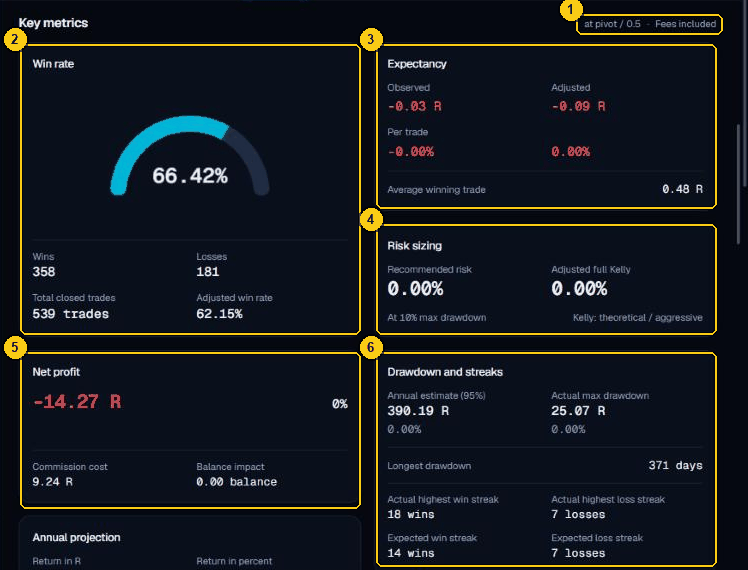
- The focused pair, and whether fees are included.
- Win rate, with wins, losses and the total of closed trades.
- Expectancy, observed and adjusted, in R and per trade.
- Risk sizing: Recommended risk and Adjusted full Kelly.
- Net profit in R, with the commission cost.
- Drawdown and streaks.
3. Let the app search
- Under Find best, choose one of Stop loss, Take profit or SL / TP combination.
- While it runs, the app shows how many combinations it has tested.
- When it finishes, a message names the best pair and its score.
It searches for the highest adjusted expectancy per trade. Use Stop loss or Take profit to improve one side while the other stays as it is. Use SL / TP combination to search both together.
4. Check the winner before you trust it
The best past setting is the most likely to be a lucky one. Before you keep it:
- Look at Total closed trades for that pair. A top score from a few trades is not evidence.
- Check that neighbouring pairs also do reasonably. One spike surrounded by weak pairs is a warning sign.
- Look at the Calendar under Week, Month or Year. If all the profit comes from one short period, the setting depends on that period.
- Test on markets or dates the search did not use, for example by generating trades for another range.
Use a test period and read the corrected edge probability
Turn on Hold back a test period before you search. Find best then only sees the older research trades. Focus the winner and read In the test period in Key metrics: it shows the same pair on the newest trades, which the search never saw. Holds up is a good sign. Does not hold up or Weaker in the test period means the winner was probably luck. Check the test period with as few different setups as you can: once it has been checked with more than 5, it is no longer an independent test.
Every combination Find best tests counts as a tried variant. Key metrics shows the edge probability for a single pre-chosen setup and, next to it, the figure after all variants tried, for example after 2,400 variants tried: at least 12.00%. A search over thousands of combinations needs a very strong result to keep a high corrected figure.
5. Save the configuration
- Click the line of the pair you want so it is focused.
- Choose Save at the top of the page.
- Enter a Configuration name and choose Save.
The Saved configurations menu lists what you saved. Choosing one restores the pair, the fee setting and the filters. With one selected, Save becomes Save changes or Save as new. Names must be unique, and your plan limits how many configurations you can save. See Plans and billing.
6. Use the configuration
- To count it in the combined balance, open the Edit tab and tick it under Portfolio. See Combine strategies and check how they correlate.
- AI training learns from a saved configuration. See Filter out weak setups with an AI model.
- Live automations run a saved configuration. See Go live with a backtested strategy on cTrader.
Common problems
- No metrics yet: click a line in the chart to focus a pair.
- Analysis connection is not ready: wait a moment or reload. See FAQ and troubleshooting.
- Find best does nothing useful: you may have only one stop loss or take profit. Add candidates on the Edit tab.
- The pair is no longer available when you apply a saved configuration: the app warns you that only fees and filters were applied. Choose a pair again and use Save changes.
- A message about Advanced trade analytics: some analytics need a plan that includes it.
Next
- Find out when your strategy works and when it does not
- Reference: Analysis, The strategy workspace and its tabs.
- To learn why optimising is risky, take the Backtesting properly course in The Learn section.